
Macro and policy: the hawkish turn
The Fed delivered a 25bp rate hike in September – its first increase since July 2023 and the first policy move under new Chairman Kevin Warsh, who took office in May 2026. Warsh also ended formal forward guidance and reduced reliance on the dot plot by declining to submit his own projection, raising uncertainty across global risk assets.
The hawkish pivot decoupled gold and crypto after months of synchronized summer moves. Higher real yields and a stronger dollar pressured non-yielding gold, while crypto rallied on record ETF inflows and forced short covering in derivatives. The divergence signals a flow-driven rather than macro-fueled crypto rally, with lower sustainability given fund flows can reverse far faster than policy stances.
Updated SEP projections lifted 2026 core and headline PCE forecasts, pushed the 2% inflation target to 2029, and signaled one additional 25bp hike by year-end. The Fed removed references to supply-side inflation, indicating willingness to tighten amid energy-driven price pressures. This resets long-standing cross-asset dynamics: geopolitical and oil shocks, historically bullish for gold, now act as headwinds, and investors can no longer count on Fed backstops for risk assets during downturns.
Markets repriced rapidly: 10-year Treasury yields topped 5% (peaking at 5.11% on 23 Sep), real yields reached ~2.8%, and the dollar index climbed ~2% above 100, raising carry costs for non-US gold buyers. With risk-free yields above 5%, cash competes directly with zero-coupon assets, pausing the summer debasement trade.
Brent crude rose 14–15% in September to an average $101/bbl, driven by Strait of Hormuz shipping disruptions and drone strikes on Saudi pipelines. While conditions eased late-month, the IEA projects full Gulf production recovery only in 2027, cementing a structural “higher oil → higher yields → lower gold” regime rather than a transient effect.
Crypto Market Performance Overview
Total crypto market capitalization rose materially in September, briefly reclaiming the $3 trillion threshold on 22 September for the first time since January. The advance was uneven: caps drifted lower in the first half, bottomed out around the FOMC decision, then surged sharply in the final third of the month.
The $3 trillion mark reflects a liquidity event, not broad-based adoption. Gains concentrated in a handful of trading sessions, marking a powerful but narrow flow-driven episode rather than a fundamental market re-rating. Persistence of inflows matters more than absolute cap levels for trend durability.
Figure 1. Crypto Market Cap in September 2026
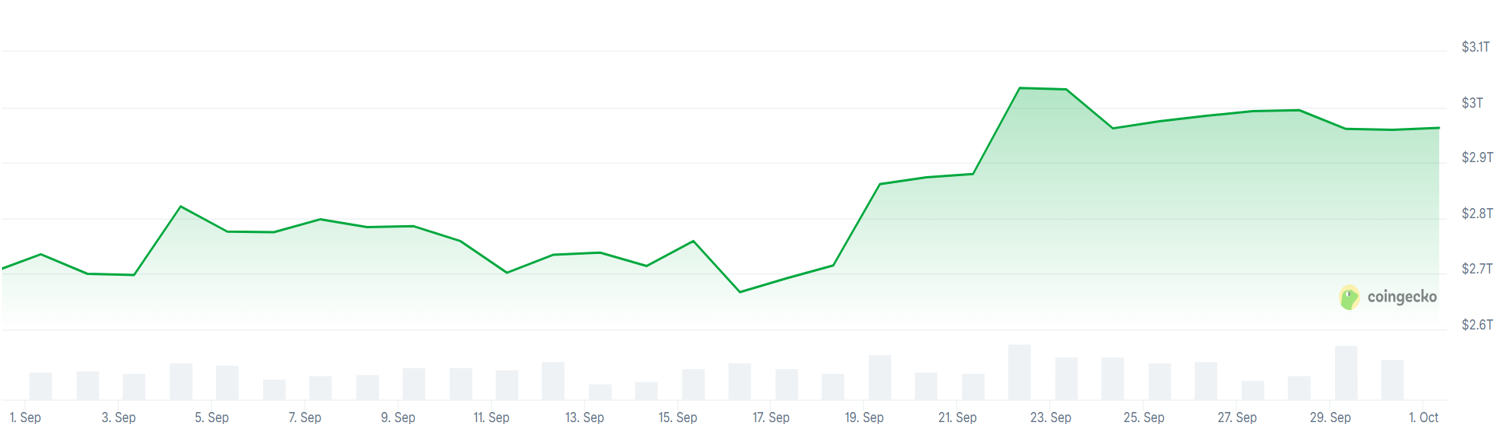
Source: Coingecko, as of 30 September 2026. Investment involves risks. Past performance does not represent future performance.
BTC posted its third consecutive monthly gain, marking the strongest July–September run since 2012. September gains decelerated versus August, however, signaling the rally relies on fewer, larger buyers rather than broadening participation.
Price action split into two phases. BTC opened near $78,500, dipped to mid-$74,000 around 15–16 September amid the rate hike and the failure to pass the Clarity Act on Sep 15, a key U.S. crypto market structure bill. The Senate cloture vote fell short of the required 60-vote threshold, extinguishing near-term hopes for federal statutory clarity between SEC and CFTC oversight and renewing concerns over regulation-by-enforcement; the dual macro-regulatory headwinds pressured prices, with support holding on two tests – a sign of exhausted marginal selling. Prices then broke out on 18 September, spiking up to $87,000 on 21 September (the highest since January), before closing the month in the low $83,000s.
The breakout was driven by concentrated institutional ETF demand and forced short covering: over $648 million in leveraged shorts were liquidated in the 24 hours around the 21 September rally, with two sessions accounting for most of the advance.
We characterize this as a flow-driven rather than valuation-driven move. Institutional ETF buyers accumulated at levels above month-end close, leaving them marginally underwater and creating fragile positioning. Failure to retest recent highs would expose mid-$70,000 support that held twice in September.
Technical signals are mixed: an early-September golden cross suggests a downtrend reversal, but the rally failed to clear the May swing high.
Figure 2. BTC Monthly Return
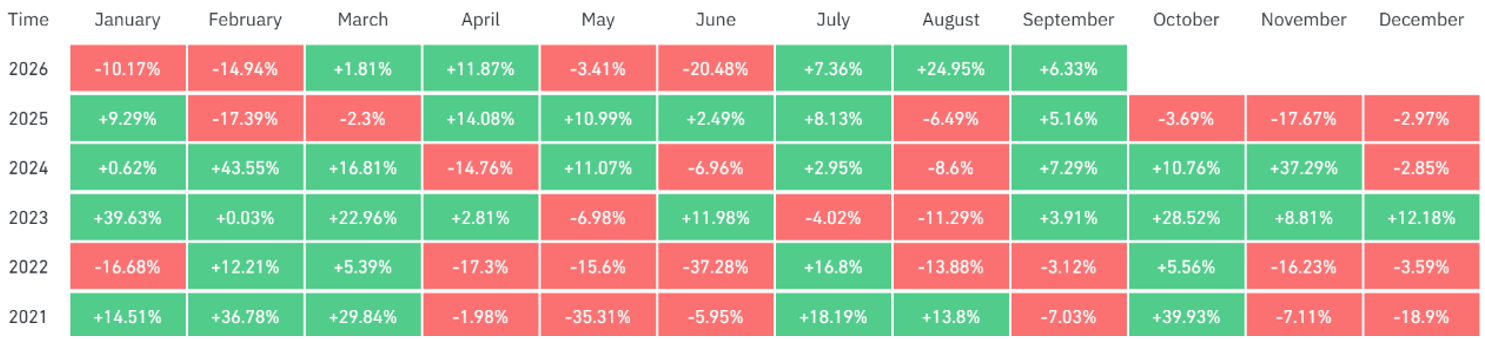
Source: Coinglass, as of 30 September 2026. Investment involves risks. Past performance does not represent future performance.
Figure 3. BTC Price Change
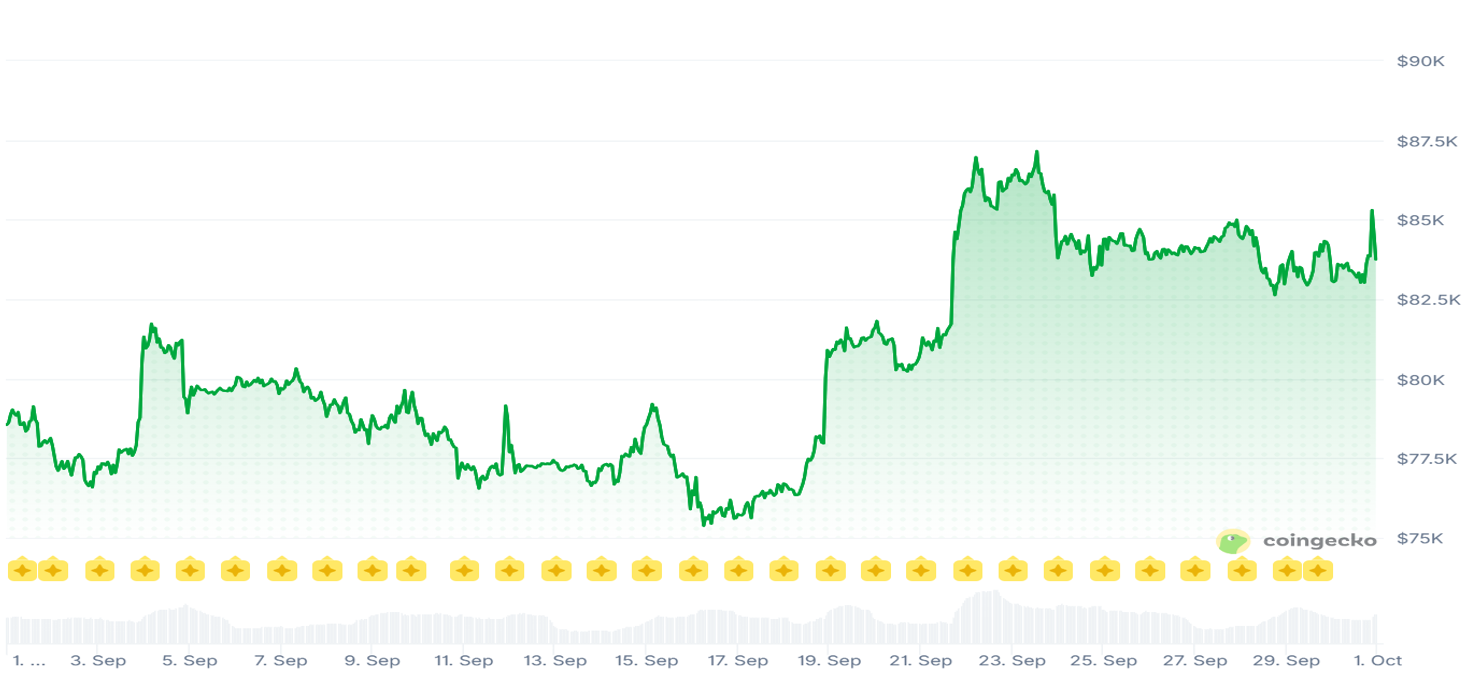
Source: Coingecko, as of 30 September 2026. Investment involves risks. Past performance does not represent future performance.
ETH also notched three straight monthly gains, closing near $2,680 and decisively above the key $2,500 level. It dipped to ~$2,400 on 16 September on shared macro headwinds, rallied to a near-$2,800 monthly high on 21 September, then eased into month-end, outperforming BTC over the period.
ETH outperformance is structural, rooted in supply contraction. US spot ETH ETFs saw four consecutive daily inflows 21–24 September, lifting cumulative net inflows to roughly $13.25–13.85 billion. Staked supply rose to 35.56% by 18 September (up from 29.8% a year prior) while exchange balances fell; top corporate holder BitMine Immersion holds 5.98 million tokens (~5% of circulating supply), mostly staked and illiquid. Reduced free float amplifies price moves in both directions.
The advance remains a recovery within a broader drawdown, with ETH still well below its October 2025 peak. High concentration carries risk: locked holdings tighten float in rallies but remove natural bid support in selloffs.
Figure 4. ETH Price Change
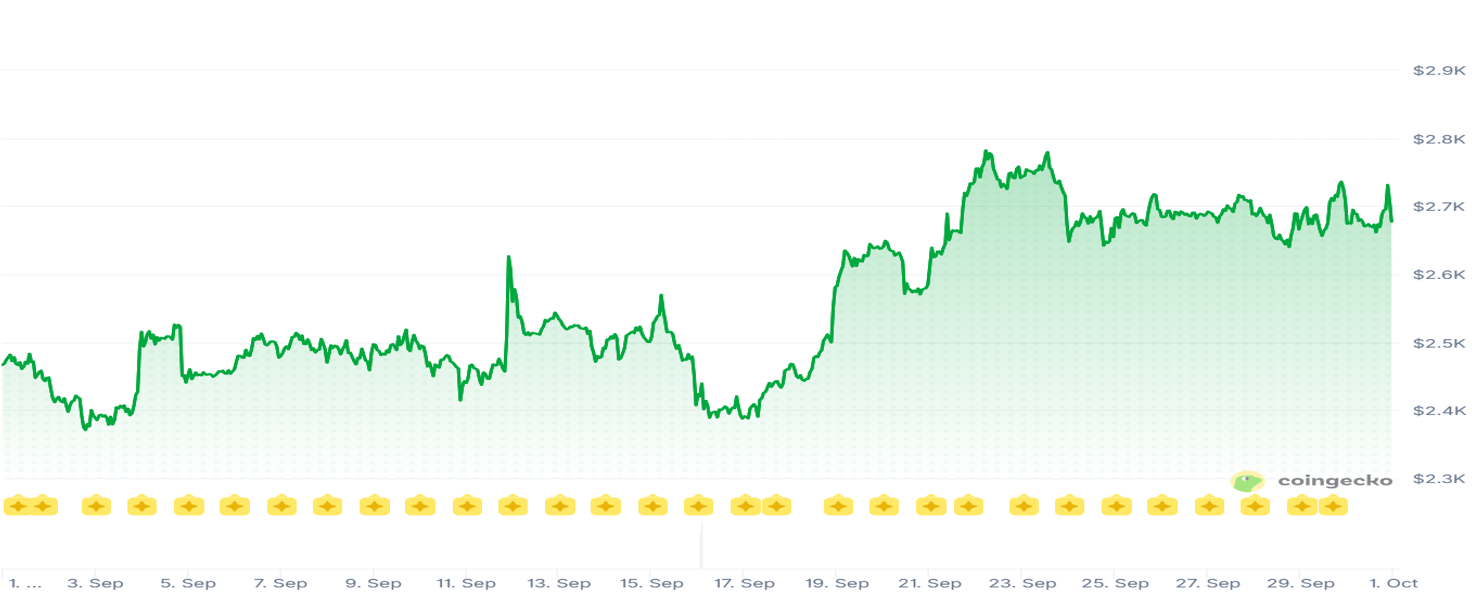
Source: Coingecko, as of 30 September 2026. Investment involves risks. Past performance does not represent future performance.
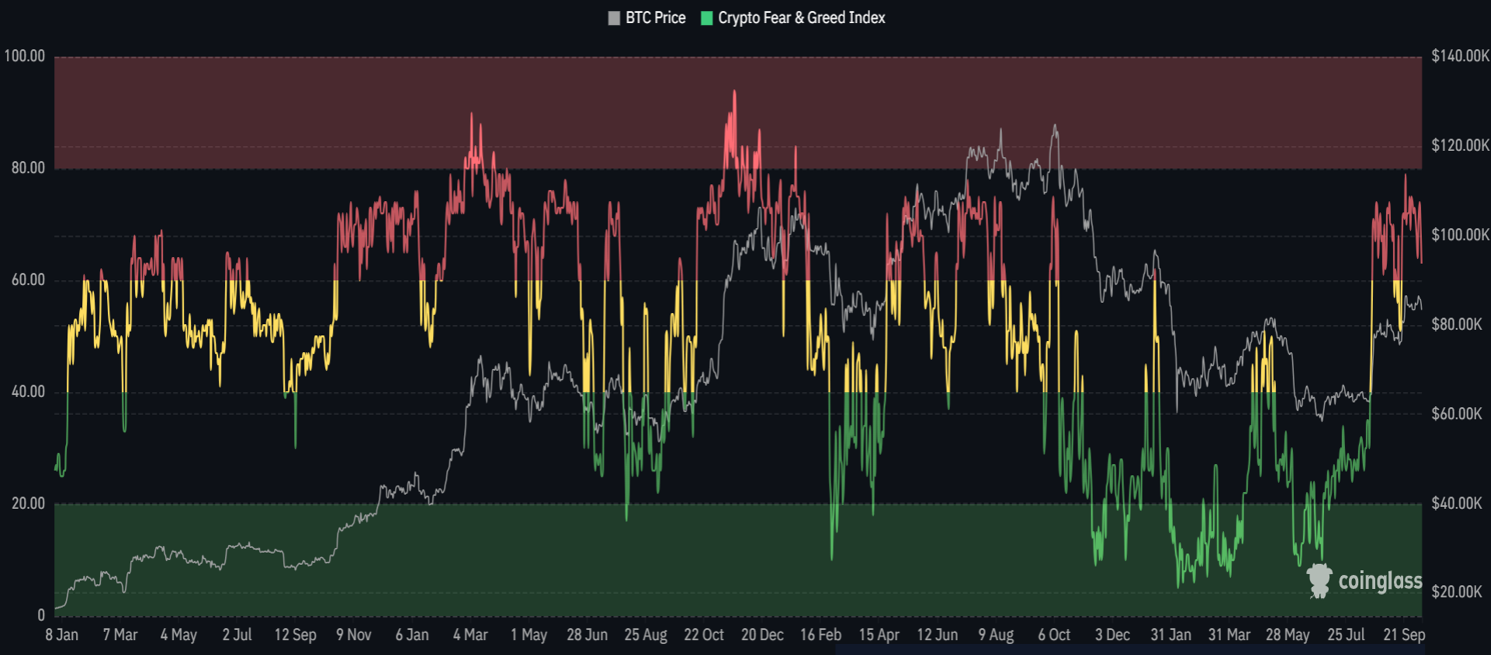
The Crypto Fear & Greed Index was broadly following price movements during the month. Momentum from the August surge was carried over to the first half of September, before slightly dipping from Greed levels back to Neutral levels around the time of the Fed’s rate hike announcement. The Fear & Greed Index swung back up to Greed territory after the announcement of rate hike was priced by markets. By and large, Bitcoin retained most of its August gains in September.
We read the dip and rebound in the index as constructive rather than cautionary. A rally that ends with sentiment and price intact is not a rally that needs to be unwound — consistent with our reading of the move as institutional and mechanical rather than sentiment-led.
Figure 5. Crypto Fear & Greed Index
Source: Coinglass, as of 30 September 2026. For reference only, does not constitute any investment recommendation.
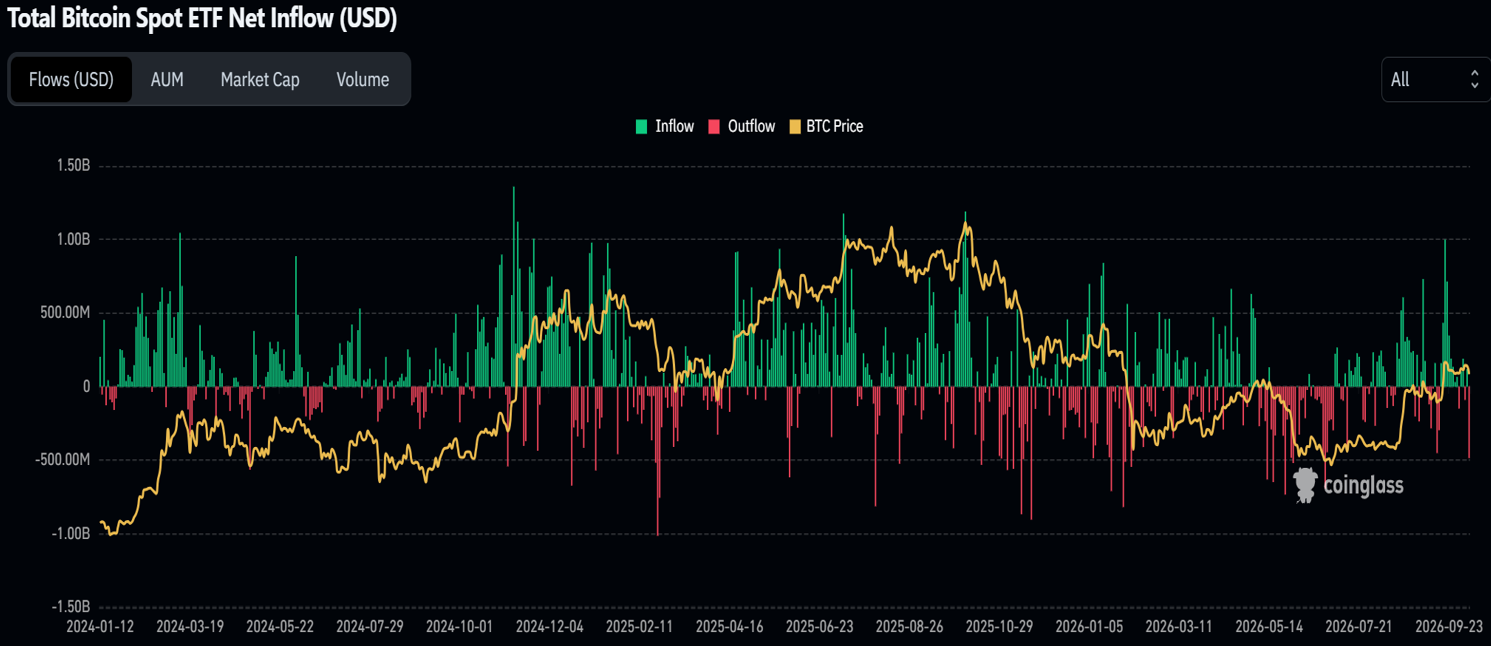
Bitcoin spot ETF flows were volatile within the month but decisively positive in aggregate, and the volatility is itself informative. The month opened with close to US$1 billion of inflows, then reversed sharply to roughly US$450 million and US$296 million of outflows on 15 and 16 September. The pivot came after 18 September: approximately US$2.65 billion entered across the five sessions to 23 September, including around US$999 million on 21 September — the largest single-day figure of 2026, concentrated in IBIT, ARKB and FBTC — and roughly US$2.39 billion in the week to 25 September, a weekly record that returned year-to-date flows to positive territory. The streak did not survive on the month-end: contemporaneous reporting points to net redemptions on 30 September, ending the run of creations that had carried the advance.
Two observations follow. Flows of that intensity are a pressure gauge, not a trend — the mid-month reversal shows creations can turn as fast as they arrive. What is more durable is the broadening of participation: leadership remains concentrated in the two largest Bitcoin products, but Ether, Solana, XRP and Zcash funds together attracted close to US$800 million over four sessions. For a market long criticised for relying on a single flow channel, that diversification is the month's most constructive development.
Figure 6. Total BTC Spot ETFs Net Inflow [1]
Source: Coinglass, as of 30 September 2026. For reference only, does not constitute any investment recommendation.
[1] Net Inflow of total BTC Spot ETFs listed in the US.
Gold Market Performance Overview
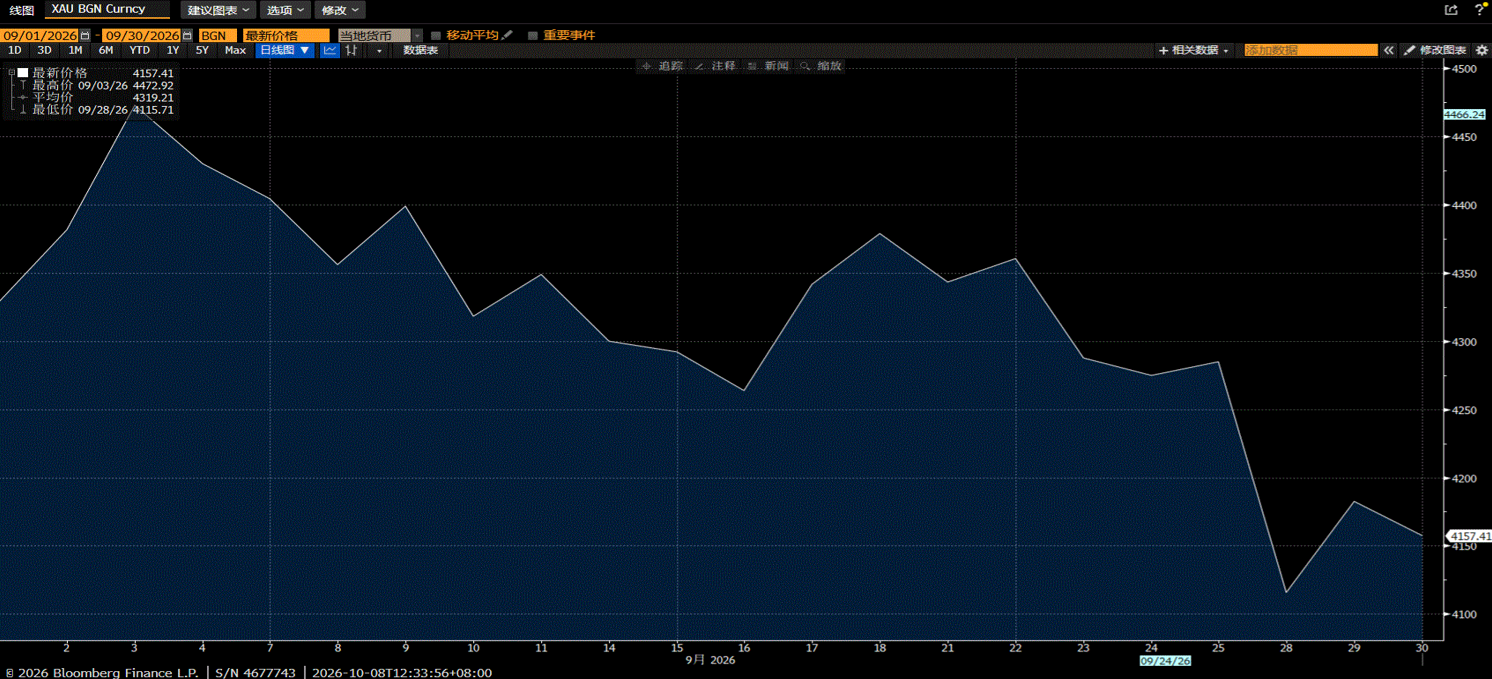
Gold posted a clearly negative September, erasing most of August’s gains with a peak-to-mid-month drawdown near 10%. It drifted lower in stair-step fashion, fell sharply in the final week, and closed near its lows. The decline was an orderly position unwind driven by higher carry costs, not a repudiation of gold’s investment case.
Higher real yields and a stronger dollar lifted opportunity costs for the non-yielding asset. Gold’s sensitivity to real yields has flattened since Jackson Hole, so dollar strength and long-position unwinding accounted for a large share of the decline; partial easing of Middle East supply risks also reduced inflation-hedge premiums.
Notably, gold fell despite elevated energy and geopolitical risks, indicating markets are pricing the policy response to shocks rather than the shocks themselves. Gold’s structural case – fiscal expansion, reserve diversification, dollar credit erosion – remains intact but dormant, awaiting a credible easing signal. Persistent official-sector buying provides a floor, with the $4,000 area widely viewed as structural dip-buying support.
Figure 7. Gold price change
Source: Bloomberg, as of 30 September 2026. Investment involves risks. Past performance does not represent future performance.
Outlook
Crypto Market
We do not recommend chasing prices at current levels. Retesting late-September highs depends on sustained ETF inflows beyond the record week and the 27–28 October FOMC meeting plus inflation data; 30 September redemptions already signal fading momentum, with the first full week of October a key gauge.
Two risks stand out: leverage has rebuilt post-breakout, with early October seeing hundreds of millions in long-dominated liquidations; and BTC’s largest corporate holder carries ~$20 billion in 10%-yielding debt and preferred stock, creating forced-selling risk in a prolonged drawdown.
Technically, the early-September golden cross should support price levels in October as the market digests profit-taking from July-trough buyers.
Regulatorily, the SEC proposed new rules for crypto asset custody by registered investment advisers and regulated funds, allowing state trust company custodians and limited self-custody. We see this as a step toward modernizing outdated regulations, which should support longer-term digital asset creation via approved channels.
Gold
Gold exhibits asymmetric dynamics. Structural supports remain, but carry costs have risen. An October hike is not a settled outcome: market pricing swung from ~70% probability to the mid-40s after dovish commentary, then rebounded on hawkish remarks. A pause would be a bullish surprise; a guided hike would extend the decline. Absent a catalyst, range-bound trading is the base case with strong support near $4,000. Pre-emptive positioning ahead of a policy turn incurs ongoing carry costs.
A key positioning insight: Under normal scenarios, geopolitical risks are bullish for gold, but in the current case, the dominant channel is inflation and rate hikes. Gulf escalation may first pressure gold via higher rates before safe-haven demand shows up.
Three Key Cross-Asset Variables
Energy: Fresh supply disruptions in the Strait of Hormuz or attacks on Saudi pipelines would reignite inflationary pressures, weighing primarily on gold and lifting crypto volatility.
Fund flows: Two to three consecutive weeks of steady ETF creations would signal a shift from a short-lived flow move to a durable crypto trend; month-end redemptions are an early warning signal.
Policy tone: The October FOMC outcome is genuinely open. A hawkish surprise would extend gold’s decline and test leveraged BTC; a pause would be supportive, with gold delivering the cleaner reaction.
Additional Risk Factors
Q4 risks persist. November US midterm elections are projected to shift control of the House and potentially the Senate, which could constrain President Trump’s policy agenda and raise political uncertainty. Ongoing Middle East geopolitical tensions also create oil price and inflation volatility.
Portfolio implication: Express macro views via gold, where policy transmission is direct. For digital assets, prioritize confirmed multi-week sustained inflows over speculative anticipation, as performance is flow-mediated rather than macro-driven.
This material is produced by MicroBit Capital Management Limited ("MicroBit") and is intended for Hong Kong investors only. All content is for general information purposes and does not constitute an offer, solicitation, or recommendation to buy or sell any financial instruments, nor is it legal, financial, tax, or investment advice.
Investments involve risks. The value of investments can go up or down, and investors may lose some or all of their invested capital. Past performance is not a guarantee of future results. You should carefully consider your investment objectives and risk tolerance and seek advice from a professional financial advisor before making any investment decisions.
MicroBit does not guarantee the accuracy, timeliness, completeness, or reliability of the information provided. All materials are presented “as is”, without any warranties of any kind, whether express or implied, including but not limited to merchantability, fitness for a particular purpose, or non-infringement. Unless otherwise specified, some of the views and recommendations are compiled by MicroBit based on publicly available data and market experience.
Securities and Futures Commission (SFC) authorization is not a recommendation or endorsement of a scheme, nor does it guarantee its commercial merits or performance. This material has not been reviewed by the SFC.
Copyright © 2026 MicroBit Capital Management Limited. All rights reserved.